ICMC USP São Carlos
Professor: Afonso Paiva
Course: Visualização de Informação - MAI5017
Student: Mohamed A. Fouad (NUSP:11930349)
July-2020
An InfoVis Utility for Spatial Choice Variety Seekers
Problem Domain
Behavioural economics, as the psychology behind economic activities(2),
is founded upon the basis of choice(3).
Spatial behavior, as a our problem domain, is defined from the
perspective of
aversiveness and indifference to proximity(4), eg. if opportunities within a
constrained spatial range are evaluated
only in terms of attraction attributes, then the individual’s
spatial choices may be spatially indifferent(4).
However, there exists a variety-seeking tendency, that is an intrinsic
tendency to engage a variation in
behavior as a goal in and of itself, such variations are known as
variety-seeking behavior(5).
And yet, spatial indifference is bounded by constraints of willingness
to traverse space over a certain spatial range to a set of opportunities
that are spatially finite.
Philosophy, Motive, Approach & Hypothesis
Our choice of a philosophy is that: "the intuitive grasp of the
essentials of
a large complex of facts leads to a basic 'law', from which, as a system
of axioms, we may derive conclusions"(7).
And as such, even that our chosen domain is foreign to us,
we understand that the key to traverse
its complex to
the clarity of the simple, is studying
its ubiquitous language's(8) most essential of constructs, and that is
the notion of behavior.
On key motive, and with a software engineering background;
we address
an actor class of our
problem domain with a software artifact,
to approach our designated notion.
We set our hypothesis as that the economic actor class of spatial
choice variety
seekers would
be better served with a more tailored InfoVis utility other than the popularly
used
Google Maps.
Project Description
We introduce twalk, an InfoVis utility,
intended to serve spatial choice variety seekers in
visualizing their spatially finite opportunities from
within a specified spatial range defined in terms of
origin/destination walking duration.
Project Structure
We follow a simple programming style of single-purpose scripts managed
via a Makefile.
Fig: Project Overview
Data Acquisition
While data acquisition is out of our scope, we needed
demo data to demonstrate our project.
Our demo data is sampled from Google's
Places and MatrixDistance API Endpoints.
For simplicity, we maintain a wide schema,
until we reach the visualization stage.
e.g. filtered.csv -> cardinal.csv -> stats.csv -> (visualization)
We filter our acquired data by a specified maximum walking duration, as
a constraint of our spatial range and store it
as filtered.csv, while keeping the original data separately.
Cardinal Direction Ranking
First, we used our origin/destinations data to calculate to which
cardinal direction each destination belongs.
We used R's GeoSphere
bearingRhumb() function.
And we relaxed the cardinal accuracy of the destinations to provide a useful
abstraction of a walking direction choice.
We calculate our descriptive statistics of each cardinal e.g.
standard deviations, means, and coefficient of variations; as for each
cardinal direction we may represent walking duration spread
via the coefficient of variations,
spatial proximity via the mean and
spatial variety via the destination count.
However, we choose to scope our current work only to the use of destination
counts
within a specified spatial range at each direction,
as a guiding score
for spatial variety.
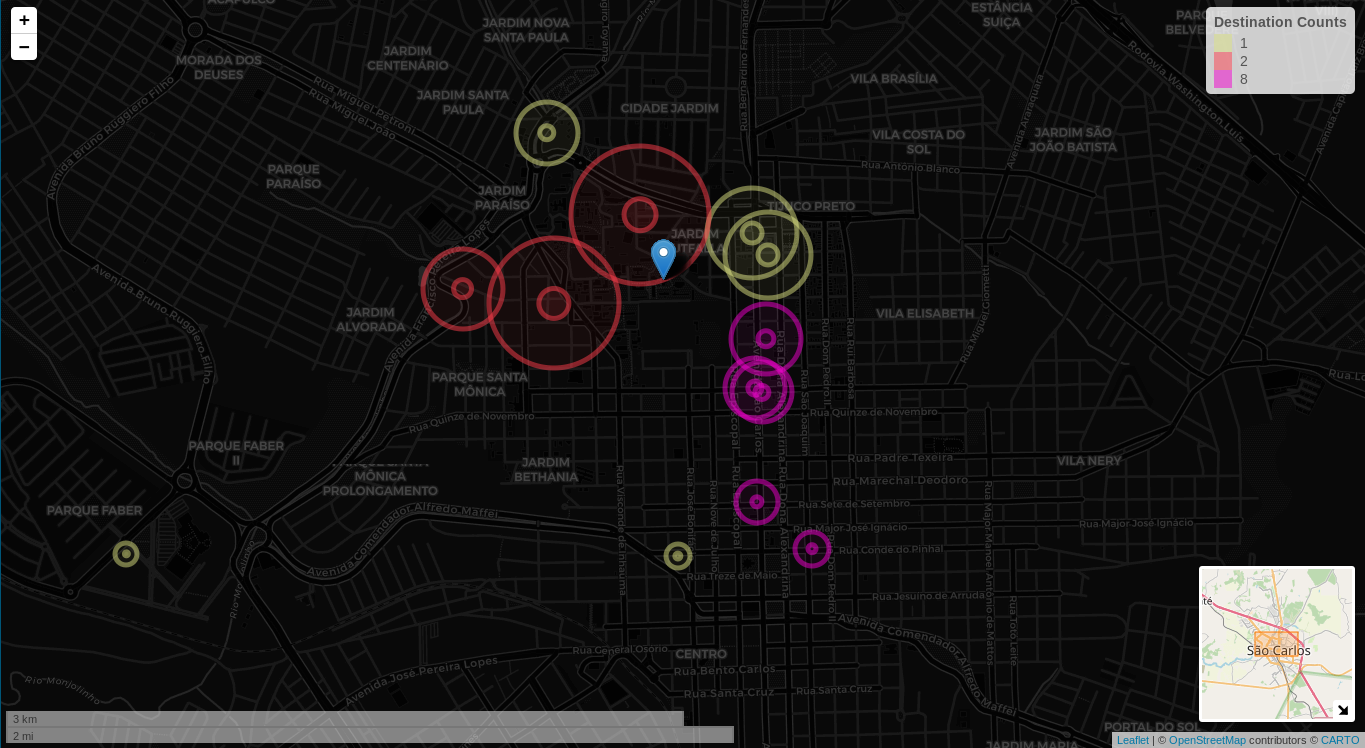
Information Visualization
Data is insufficient for meaningful communication
while information, as data transformed and interpreted within context is.
And while Visualization is a cognitive activity, facilitated by
external stimuli from which we build internal mental representations
of the world (1);
Information Visualization is the process that provides a capability,
for transforming data into information(1).
We note that the more specific the question we are asking,
the more specific and clear the
visual result will be(6). And as such our single-purpose utility employs
minimal visual constructs to deliver its intended answer to the question:
Which walking direction(s) would offer more opportunities for a
spatial choice
variety seeker?
And to answer,
our process of transforming data into information
included the feature use of spatial orientation,
color, size, and user interaction:
1. We provided our users with a spatial orientation via the use of a map.
2. We offered a map's legend to color associate a spatial direction with
destination counts.
3. We represented walk duration proximity via size, the bigger the radius
of a destination circle, the closer it is to origin.
4. And finally, we offered information on-demand via user's interaction e.g. popup interaction.
Conclusion
Spatial indifference is bounded by constraints of willingness to traverse
space over a certain range, and regardless of variety-seeking behavior,
the set of opportunities considered by an individual when making a
spatial choice are spatially finite. We employed cardinal directions and
destination counts to offer, through spatial visual constructs of color and
size, each walking direction opportunities.
And as we are spatial choice variety seekers ourselves, we find that our
utility yeilds,
more than Google Maps,
a visually instant
answer to the question:
Which walking direction(s) would offer more opportunities for
a spatial choice variety seeker?
and hence we accept our hypothesis.
In aggregate,
Information Visualization offers
a much needed aid, and our introduced utility presents useful
visualization of
the spatially finite opportunities for its intended audience.
Acknowledgment
We are very grateful to
Osafu Augustine Egbon (NUSP: 11494792),
an ICMC Statistics PostGrad, for his
enthusiasm and diligence in fulfilling our various statistical inquiries.
(1)
"Introduction to Information Visualization",
Riccardo Mazza,
Springer,
2009
(2)
"Theory of Games and Economic Behavior",
Oskar Morgenstern and John von Neumann,
Princeton University Press,
1944
(3)
"Urban Dynamics and Spatial Choice Behaviour",
Joost Hauer, Harry Timmermans, and Neil Wrigley,
Kluwer Academic Publishers,
1989
(4)
"Spatial Choice Theory and Spatial Indifference: A Comment",
Frank Stetzer and Alan G. Phipps
(5)
"Variety-seeking in Product Choice Behavior",
Hans (J.C.M.) van Trijp,
Pudoc Scientific Publishers
1995
(6)
"Visualizing Data",
Ben Fry,
O'Reilly,
2008
(7)
"Building Theories: Heuristics and Hypotheses in Sciences",
David Danks and Emiliano Ippoliti,
Springer,
2018
(8)
"Domain-driven Design: Tackling Complexity in the Heart of Software",
Eric Evans,
Addison Wesley,
2003
 ICMC USP São Carlos
Professor: Afonso Paiva
Course: Visualização de Informação - MAI5017
Student: Mohamed A. Fouad (NUSP:11930349)
July-2020
ICMC USP São Carlos
Professor: Afonso Paiva
Course: Visualização de Informação - MAI5017
Student: Mohamed A. Fouad (NUSP:11930349)
July-2020
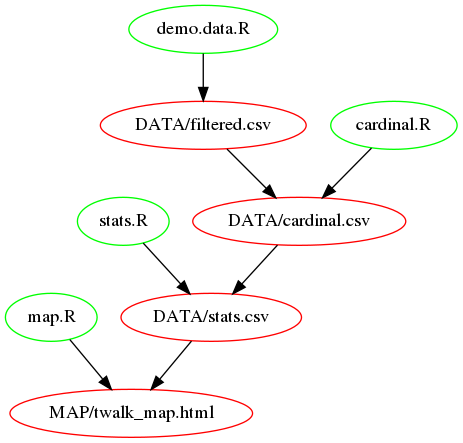 Fig: Project Overview